The analog linearization table settings determine how the raw measurements made by the analog input point are filtered, scaled and offset before being presented as a network variable in engineering units. The table has two columns: Input, and Engineering. The Input column shows values of the input signal at the input terminal. The Engineering column shows values of the network variable assigned to the input. The table creates a correlation between the input signal values and the engineering units value.
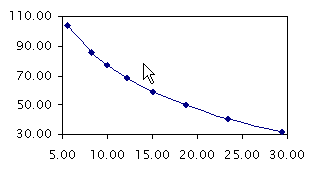
There are eight rows for scaling the input data to an engineering value with each row corresponding to an X/Y coordinate. The minimum number of coordinates allowed is two: the beginning and end points of a line. As more coordinates are added to the table, non-linear relationships can be described, as shown in the table and in the chart example of a typical 10K type III thermistor below. Rows not used should have a zero value for both columns.
The values in the Input column must be monotonically increasing, that is, each successive value must be greater than the previous value.
When an input value that is less than the value above it is entered, the input point object considers that value to mark the end of the valid linearization data.
Figure 24: Analog Input Linearization Table for 10k Thermistor and SNVT_temp_p
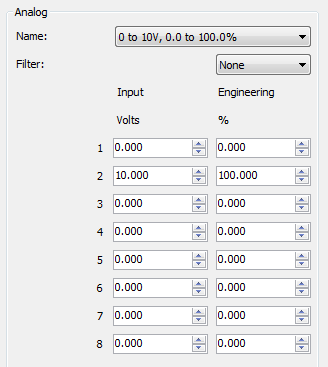
Figure 25: Graph of a 10K Ohm Thermistor input with SNVT_temp_p